How to Monitor a Trading Bot in the First 30 Days: KPIs and Shutoff Rules
Make Your First 30 Days Your Safest 30 Days
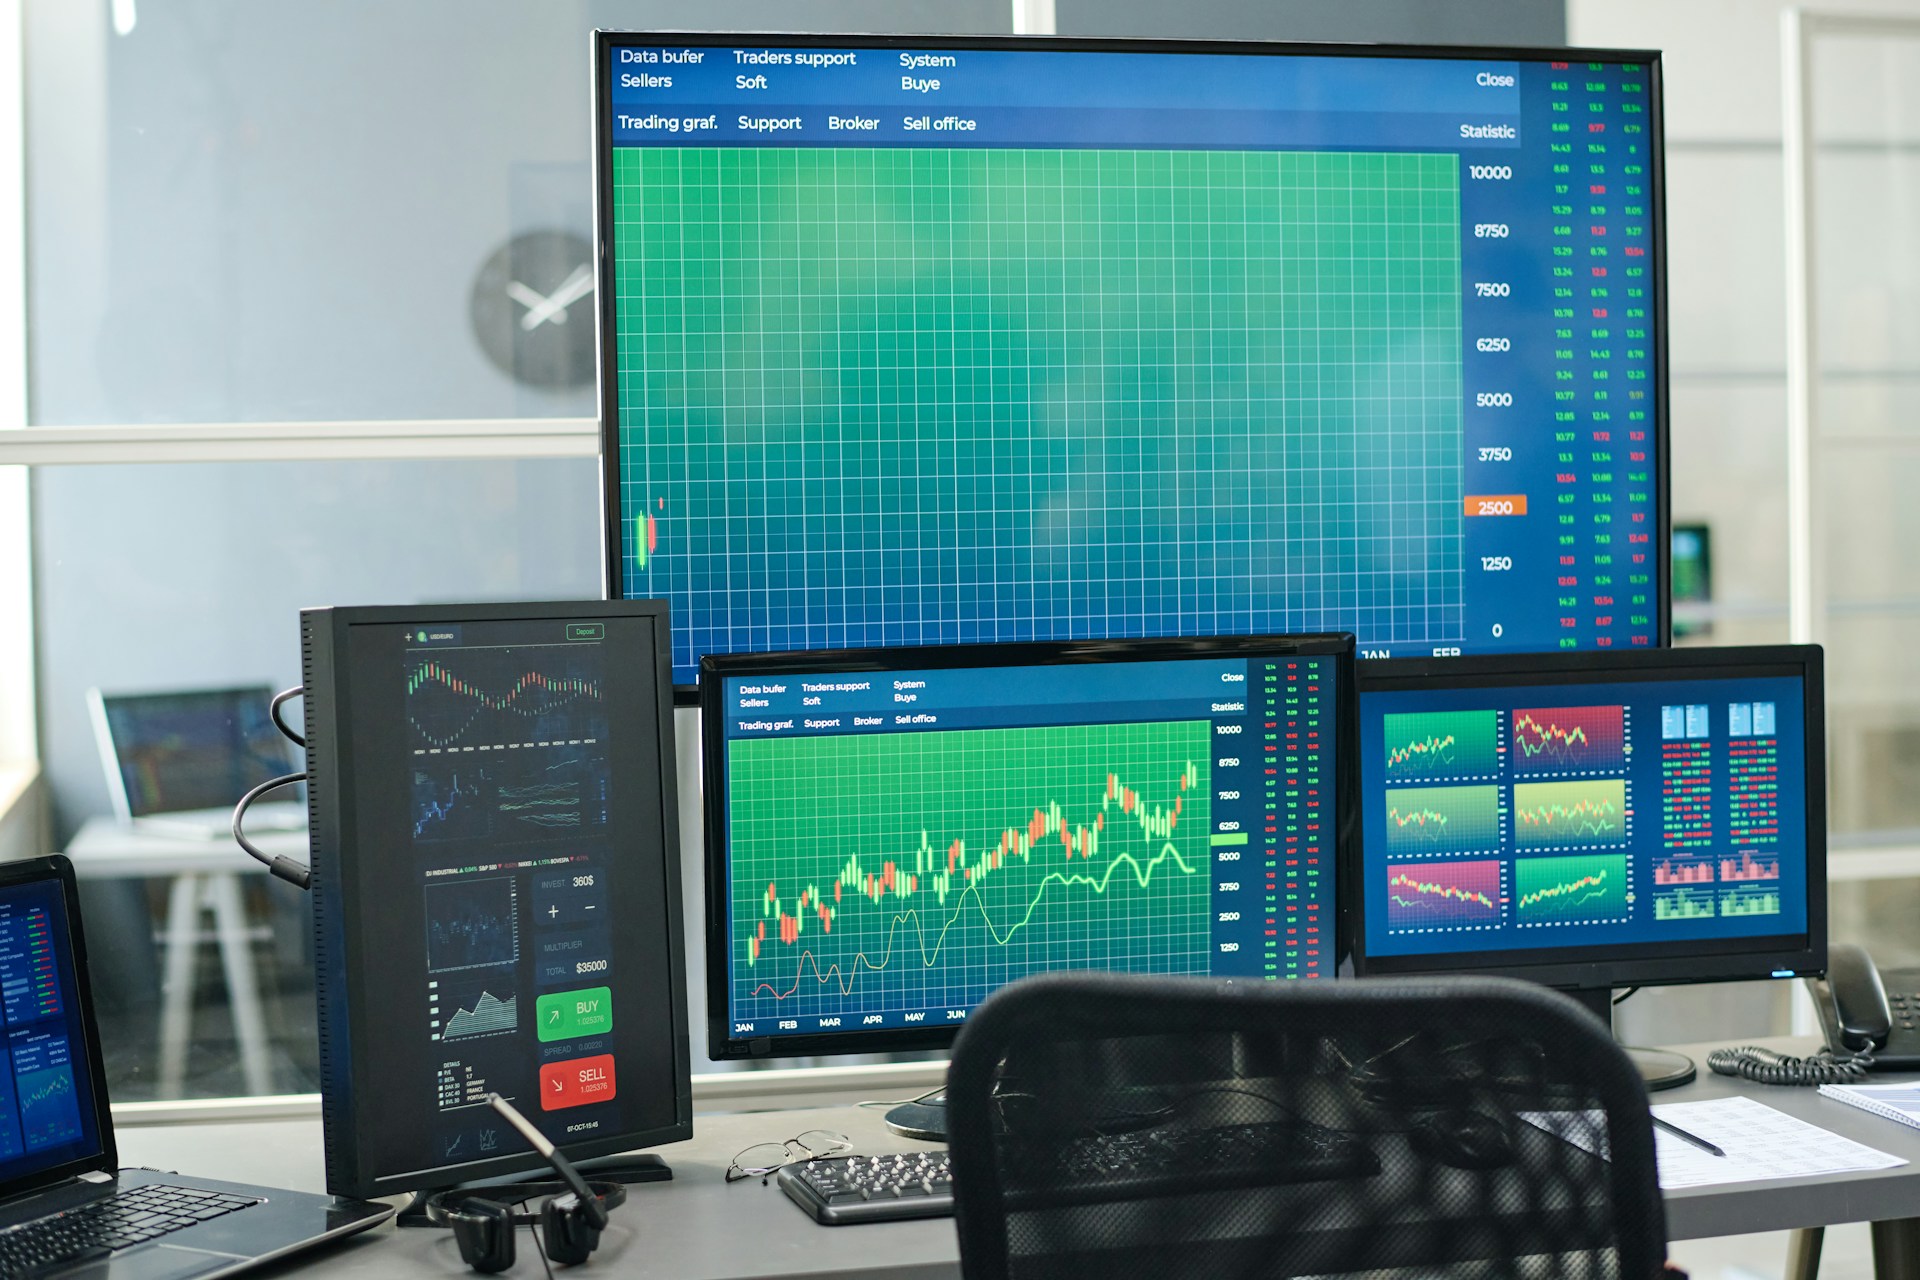
Going live with automated trading software is exciting, but it is also the point of highest risk. You are moving from clean backtests and demo fills into real spreads, real slippage, and real emotions. New broker relationships, fresh VPS setups, and live liquidity can all expose weak spots fast.
That is why the first month should not be about chasing profits. It should be about testing the whole chain: strategy, settings, broker, and tech. Think of it like a post-purchase audit, a safety net that helps you confirm that your bot behaves like it did in testing, before you scale up size.
In this guide, we will walk through what to watch in those first 30 days, including:
The risk guardrails you set before the first trade
Daily and weekly KPIs that flag hidden problems
Simple broker execution checks
Clear rules for when to pause or shut off the bot
Spring is a great time to do this work. After the choppy moves of Q1 and before the thinner summer sessions, many traders treat Q2 as “portfolio spring cleaning,” tightening risk and stress-testing every system.
Set Clear Risk Guardrails Before Day One
Before your bot ever places a live trade, you should know exactly how much you are willing to lose. Not “we will see how it goes,” but clear numbers, in both percentage and dollars. Pre-committed rules keep you from making panicked choices when the market heats up.
A simple starting point for the first 30 days is:
A max equity drawdown, for example 5 to 10 percent
A daily loss cap, where trading stops for the day if hit
A limit on consecutive losing days before you review or pause
Write these down. Treat them like a trading plan for the bot. If your equity hits that max drawdown, you stop, no debate.
Position sizing is also key with automated trading software. You want to know:
Risk per trade as a percent of your account
Total exposure across correlated pairs, like EUR and GBP crosses
How much leverage your broker is giving you
High leverage can make even a small lot size dangerous if the bot stacks trades in the same direction. This is where we separate strategy risk from execution risk. A strategy can be sound, but the wrong lot size, margin settings, or account type can still blow up the first month. The goal is to keep risk small until the live setup has a track record.
Daily and Weekly KPIs That Reveal Hidden Problems
Once the bot is live, the job shifts to measuring what it is actually doing. We want to catch problems early, not after a big loss. So we track a few simple KPIs each day.
Daily checks might include:
Win rate
Average win size vs average loss size
Number of trades taken
Net pips
Daily return on equity
The key is not the exact numbers, but whether they are in line with your backtests and demo. If the bot usually trades 5 to 10 times a day and suddenly fires 40 trades, that is a red flag. If average loss is now much bigger than average win, that matters too.
Weekly KPIs smooth out the noise and show the bigger picture, such as:
Weekly profit factor, gross profit divided by gross loss
The slope of your equity curve, gently rising, flat, or dropping
Max intraweek drawdown
Volatility of daily returns
A simple routine can work well. Plan 10 to 15 minutes each day to log key numbers, then 30 to 45 minutes at the weekend for a deeper review. When something looks off, write it down. Note things like:
Missed trades that should have triggered
Unusually wide spreads at certain hours
Partial fills or strange close prices
Institutional-grade systems rely on this kind of structured monitoring. Algorithms are not magic; they are tools, and even strong tools need regular checks in different market conditions.
Broker Execution Checks That Can Save Your Account
Your bot can only be as good as the fills it gets. So in the first 30 days, we want to test the broker’s execution as carefully as we test the strategy.
Start by comparing expected versus actual entries and exits. For each trade, look at:
The entry price your rules would expect
The actual fill price
The spread at that time
Any slippage, positive or negative
Some slippage is normal, especially around news or thin liquidity. What you want to spot are patterns of bad execution in normal conditions. Red flags include:
Frequent requotes
Large slippage even when the market is calm
Unexplained trade rejections
Execution delays during regular data releases, which can be common in late Q2
If you can, keep a side-by-side comparison for the first month, maybe with a demo account at the same broker or with a second broker. If the same strategy performs fine on one feed and poorly on another, that points to an execution issue rather than a strategy flaw.
When things seem off, collect evidence. Save:
Screenshots of charts and order windows
Trade logs from your platform
Journal entries from MT4 or MT5
With clear records, you can have a focused talk with broker support and decide whether you need a different account type, server, or, in some cases, a different broker.
When to Hit Pause vs. When to Shut It Off
Not all pain means something is broken. Every strategy has drawdowns, and losing streaks are part of trading. The key is to know the difference between normal pain and a system failure.
Normal pain looks like:
Drawdowns that stay inside backtested limits
Losing streaks that match past patterns
Small changes that line up with current market conditions
System failure looks like:
Equity dropping past your pre-set max drawdown
Big changes in trade frequency or pattern
Repeated technical errors or crashes
KPIs drifting far from historical norms for several weeks in a row
A simple decision tree for the first 30 days might be:
First alert, like a strange spike in trade count, reduce lot size and watch closely
Second alert, such as another rule break or tech issue, pause trading and review logs
Any break of your max drawdown or clear execution abuse, shut the bot off and reassess the whole setup
Keep notes on every change you make, including lot size tweaks, broker changes, and parameter updates. Clear records help you judge performance later and avoid repeating the same mistakes.
Build a 30-Day Monitoring Plan You Can Trust
If we put this all together, the first month with automated trading software should follow a clear plan. Set your risk guardrails before day one. Define your daily and weekly KPIs. Test how your broker is actually filling trades. Decide in advance when you will pause, when you will cut size, and when you will shut it off.
At Forex Fortune Factory, we see automated trading as a professional tool, not a set-and-forget money machine. The real edge comes from pairing algorithmic research with disciplined oversight, especially in those early weeks when live conditions in the forex market can shift with the season and global news.
Use this framework to build your own 30-day checklist and calendar. When you treat that first month like a formal audit, you give your bot a fair test, protect your capital, and set yourself up to scale with confidence after the trial period is over.
Automate Your Trading To Capture More Opportunities
If you are ready to reduce emotional decision-making and trade with consistent rules, our automated trading software is built to help you act on your strategy around the clock. At Forex Fortune Factory, we design tools that let you test, refine, and deploy your approach with precision. Get started today so you can focus on your edge while the system handles the execution.
